This post is a collection of notes for useful setups, tricks and utilities in VSCode, as one of the popular IDEs in the market, along with
Sublime Text, Atom, JetBrains, and so many to name.
Python Debugger
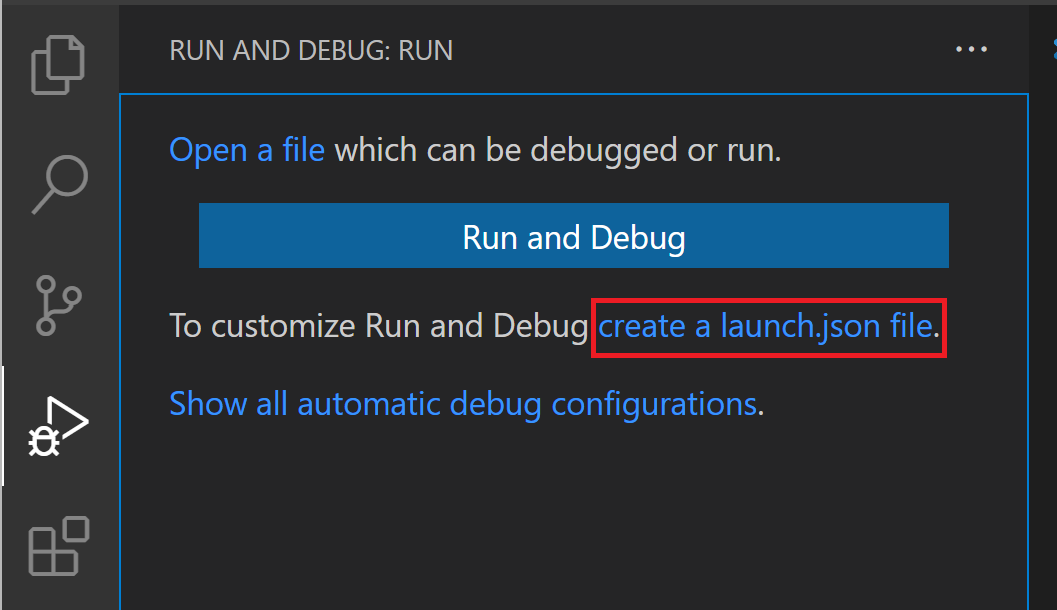
Running the debug mode for coding in IDE is a very convenient feature, as we can put in break points and check variables in our program without killing the running process. In VSCode, to run the debug mode - here I am taking Python as the example - we need to first download the debugger extension. For Python debugger, we can just search in the extension sore within VSCode and we should be able to find the Python debugger listed to be installed. Once installed, we can go to the Run and Debug option in the left sidebar and try to run the program in the debug mode. Initially, it will ask us to populate the configuration file, if we have never used the debug before, as shown here. Clicking on the link as shown in the picture, we will be brought up with the configuration JSON file to populate. We can put something like below in the file,
{
    "version": "0.2.0",
    "configurations": [
        {
            "name": "Python Debugger: Current File",
            "type": "debugpy",
            "request": "launch",
            "python": "/Users/y8z/opt/anaconda3/envs/g2python311/bin/python",
            "program": "GSASII.py",
            "console": "integratedTerminal"
        }
    ]
}
Here, the program option will specify the relative path (with respective to the workspace folder) to the main Python file to be executed. By default, the python entry will not be created but it is actually necessary as it specifies the full path to the Python executable (which then determines which environment we will be using) to be used for running the Python script. Once all the entries above are populated properly, we can then hit the Run button in the Run and Debug option to start the debug mode. Here, we can first insert some breakpoints in our codes (by clicking on the left edge of the editor corresponding to a certain like and red circle will be shown to indicate the breakpoints). Then when the running program hits the breakpoint, it will bump into the debug mode, allowing us to bring up the command console – we can use ctrl+` to bring up the terminal panel where we can find the DEBUG CONSOLE among the top option tabs in the terminal panel. We can also go to the top part of the editor to find the several options to control the flow of the debug mode, e.g., to move forward, i.e., to skip the current break point.
Run Python file
To run a Python file within VSCode, we need to first set up the proper Python interpreter. If we don’t do that, VSCode will try to pick up some Python from the system paths, but usually, that will not work with our Python script. To select the Python interpreter to use, we can bring up the command palette and type in Select Interpreter so that we can see and select the proper interpreter to use. Or, we can define a shortcut for it.
Sidebar Focus
On the left side of VSCode, there is a sidebar containing quick access to different categories of operations, including File, Git, Search, Extensions, etc. We can define shortcuts to quickly switch to any of those categories. To do this, we can go to the shortcut settings and search for Focus on in the search box. Then we can see a whole bunch of options from which we can select whichever one relevant to define a shortcut for it.
GitHub Copilot
With GitHub Copilot, we can do a lot of stuff in a very handy way. The most commonly used feature is probably the code auto suggestion. As we are coding, Copilot will smartly suggest what we might need and bring up hint for what is expected to be typed. If we think the suggestion is good to be accepted, we can simply press Tab so that the suggestion will come in. The actual experience with its smartness is amazing! It seems that it can automatically analyze the context of the codes and make very relevant suggestions. Another useful thing is Copilot chat, which is by itself just a chatbot like ChatGPT. We have the option to have a side chatbot, with which we will have a side panel for the chat. Or, we can bring up a dedicated tab for the chat. Whichever one, it is a very handy tool so that we can get access to the a ChatGPT-like interface without leaving our coding environment. There is a quick access button in the left sidebar for bring up the side chatbot. We can also define a shortcut for it by going to the shortcut settings and search for Chat : Focus on Github copilot View so that we can define the shortcut for the command. To define a shortcut for bringing up the dedicated chatbot tab, we search for Chat: Open Editor (GitHub Copilot) and define a shortcut for the command.
Actually, there is a default shortcut defined for bringing up the sidebar chatbot, namely
Shift+Cmd+I. In the editor view, pressing this key combo will bring up the sidebar chatbot. However, if we bring up the command palette first and type in something, we can then press the key combo to bring up the sidebar chatbot and at the same time kicking off the conversation with the text we typed in, in the command palette.